

Markout Analysis for Brokers
A client buys one lot of EURUSD from you at 1.10000. A tenth of a second later the market mid sits at 1.10005. He has not closed anything and may hold the trade for a week. But look at what already happened: you sold him something that was worth five dollars more a moment after you sold it.
Once, that is noise. The market wobbles in both directions. Do it again and again from the same account and it stops being noise. That client either sees your price before you refresh it, or knows where the market is going. Either way you pay on every fill, and it makes no difference whether the trade finally ends in profit or loss. That is toxic flow, and the number that measures it is the markout.
The Markouts screen in Brokerpilot calculates it for every opening trade on your MT4 and MT5 servers. Then it does the part that normally eats an analyst's week: it shows you which symbols, which accounts and which kind of flow.
- 7 horizonsfrom 100 ms to 60 s after every single trade
- 24 hoursrolling window for the heatmap and the account table
- 3 metricsTotal USD, Adverse USD and USD per million
A Thermometer, Not a Ledger
People new to markouts keep mixing them up with profit and loss. Don't. A markout does not tell you what the client made, and it does not tell you what you lost.
-
Not the client's result
A client can enter at a brilliant price, hold too long and close at a loss. The markout stays positive. Only the first 60 seconds after entry count, however the trade ends.
-
Not your real loss
What you actually lose depends on whether you hedged and how the client exited. A markout grades the quality of the price you gave.
-
A fever detector
It does not count the cash in the till. It shows where your pricing runs a temperature, and that is exactly what a dealing desk needs to know first.
The old way to find a problem client was to wait until the profit became embarrassing and then investigate for weeks. A markout shows the same pattern after a few dozen trades.
Seven Moments After Every Trade
Every trade is measured at 100 ms, 200 ms, 300 ms, 500 ms, 1 s, 5 s and 60 s after entry, against the middle of the spread. Positive always means the market went the client's way, for buys and sells alike. Back to the EURUSD lot:
| After | Mid price | Markout |
|---|---|---|
| 100 ms | 1.10005 | +$5 |
| 1 s | 1.10008 | +$8 |
| 60 s | 1.10002 | +$2 |
The edge peaked early and then melted away. That shape is the whole story, and it is why a single number is never enough. Take two clients with the same markout at 100 ms. If the first one's advantage is gone by the 60th second, he is simply faster than your quotes, and the fix is on your side: speed up the feed or add a little execution delay. If the second one's advantage keeps growing, he is guessing direction better than you, and that is a question for your risk policy. Same number, opposite cures.
The Heatmap: Follow the Red
Rows are instruments, columns are the seven horizons, and every cell adds up the last 24 hours. Gold traded as XAUUSD on one server and XAUUSDb on another lands in a single row with a small badge, so you see the whole picture for gold and can still expand the row to see each name. Click a row and its decay chart opens on the right.
-
Total USD
The net cost of client entries on this symbol, wins and losses together. Negative means you are ahead.
-
Adverse USD
Only the client's winnings. Make $100,000 on ordinary flow and lose $95,000 to two arbitrageurs: Total shows a calm $5,000 profit, Adverse shows the $95,000 problem.
-
USD per million
Toxicity per unit of volume, so a thin exotic pair and a busy major can be compared fairly. A million on EURUSD is background noise. The same on a quiet exotic is a disaster.
One thing trips up everybody at first: the colour does not follow the number in the cell. Redness shows what share of all the adverse flow on the screen sits in that cell. So a cell can read minus $8 million, meaning you made money, and still glow deep red: a profitable symbol with a toxic core hidden inside. Follow the colour to find the problem. Read the number to size it.
The Decay Chart: Three Shapes, Three Decisions
Seven dots joined by a line, average markout against time, for one symbol at a time. Read the shape, not the height. The vertical axis is in the symbol's own price points, which is why you should never compare the height of two different symbols' charts.
-
Flat, hugging zero
Ordinary client flow. Clients guess right about as often as they guess wrong. Nothing to do.
-
Spike, then fade
A jump between 100 and 500 ms that is back to zero by 60 seconds. Somebody wins the first fraction of a second against your stale price. Look at your price feed and execution settings.
-
Steady climb
The advantage does not fade because the market keeps moving their way. They know something. A technical fix will not help, so this goes to your risk policy.
One detail worth knowing: each dot is a plain average over trades, not weighted by volume. A single huge trade cannot drown out a hundred small ones. The chart shows how the flow behaves. The other columns show the money.
From the Symbol to the Person
Below the heatmap sits a table of accounts, sorted by Adverse $ over the last 24 hours. A login that exists on two servers appears twice.
- Class. Benign, Informed, LatencyArb or Unknown, assigned from the shape of the account's decay curve across all its symbols.
- Contribution, %. The share of all adverse flow created by this account. If one login owns most of it, closing that single case solves most of the problem.
- Trades. How many opening trades the numbers rest on. Check it before you trust a label.
- One click to the dossier. Click the login for the account card. Click anywhere else on the row for the client panel.
The client panel gives you the 14-day adverse markout, a decay chart built only from that client's trades on his most problematic symbol, a bar for every day and a table of what he trades. Even bars day after day mean an algorithm. One giant spike means an event, such as news. Different story, different response.
Read the Fine Print Before You Quote a Number
- Adverse $ is a toxicity rating, not accounting. Wins never offset losses in it. Do not put it in a financial report or show it to a client.
- "LatencyArb" is an inference from price behaviour. Nobody measured the client's ping.
- One trade earns the same label as ten thousand. That is what the Trades column is for.
- MT4 and MT5 servers only. Other platforms may appear in the filter but will show no data.
- Two time windows. Everything is a rolling 24 hours, except the 14-day tile and the daily bars on the client panel. If two numbers disagree, check the window first.
A Five-Minute Morning Routine
- Open the heatmap and look for the reddest cells. Switch to USD per million when you want a fair comparison between symbols.
- Click the worst symbol and read the shape of its decay chart. Spike and fade is speed. Steady climb is information.
- Scan the account table. Contribution % tells you whether one client is the problem. Class gives the type, Trades tells you if the data is solid.
- Open the client panel, check the daily bars and decide: speed fix, tag the account, or change the terms.
Markouts Interface
Filters on top, the symbol heatmap on the left and the decay chart on the right.
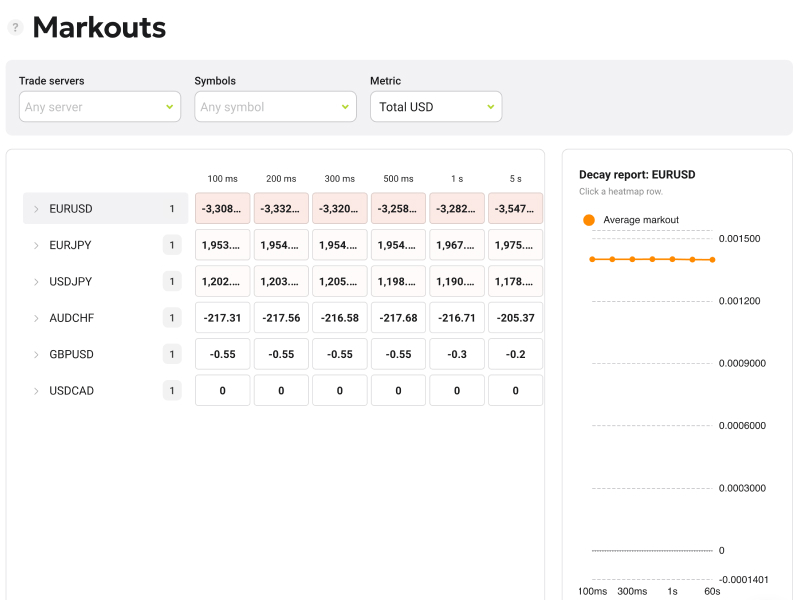
The Markouts screen
Questions About Markouts
What is a markout in forex and CFD brokerage?
It is how far the market moved in the client's favour a set time after their trade. Positive is bad for the broker. Measured over many trades, it separates normal flow from latency arbitrage and from informed flow.
How is a markout different from PnL?
PnL is a result. A markout is a measure of price quality in the seconds after entry. It ignores how and when the client closes the position.
Can markouts show latency arbitrage?
Yes, through the shape of the curve: a spike in the first 100 to 500 ms that fades by 60 seconds. It is a conclusion drawn from price behaviour, so check the number of trades behind it.
Which platforms are supported?
Markouts are calculated for MT4 and MT5 servers.
How far back does the data go?
The heatmap and the account table use a rolling 24 hours. The client panel adds a 14-day view.