Symbol-level unusual P&L events are one of the earliest warning signs that something might be wrong with execution or risk parameters. When a specific instrument shows unexpected profit or loss patterns — far outside its normal range — it can signal mispriced quotes, latent latency issues, or concentrated client activity. Left unmonitored, these anomalies may quietly erode the broker’s financial stability.
What Is an Unusual P&L Pattern
An unusual P&L pattern emerges when a symbol regularly delivers profitability (or losses) that deviates significantly from historical norms. Often the pattern remains invisible at the aggregate book level but becomes obvious only when you inspect symbol-by-symbol performance. Typical signatures include asymmetric wins, repeated short-term spikes, or sustained gains that outpace expected volatility.
Why Such Anomalies Happen

There are multiple root causes for abnormal symbol-level P&L behaviour. Among the most common are: latency or execution delays; misalignment between broker’s quote feed and external markets; concentrated exposure in specific client clusters; or insufficient hedging when volatility spikes. Any of these — alone or combined — can distort results on particular symbols while leaving the rest of the book apparently healthy.
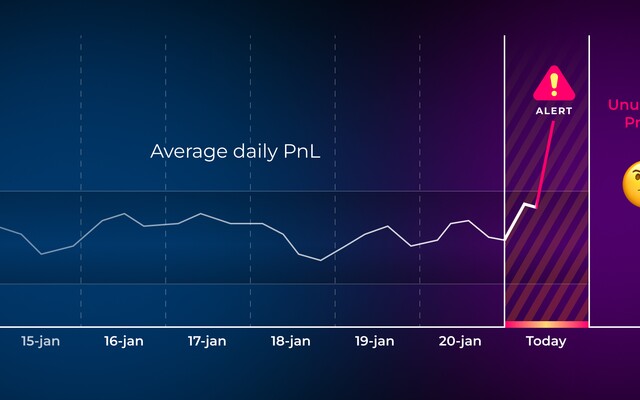
How Brokerpilot Detects P&L Outliers
Brokerpilot monitors each symbol’s performance over configurable time windows, comparing realized and unrealized P&L against expected historical volatility and typical flow patterns. When a symbol diverges beyond defined thresholds, the system raises alerts and highlights the affected instruments. This allows risk teams to quickly investigate whether the deviation is caused by infrastructure, client flow anomalies, or risk-model misconfiguration.
Operational Benefits for Brokers
- Early detection of execution inefficiencies or quote-feed problems before they scale into sizeable losses.
- Immediate visibility into which symbols — not just accounts — pose danger or opportunity, enabling precise hedging and risk adjustments.
- Reduced reliance on end-of-day reports — alerts happen in real time and guide proactive risk management.
- Better understanding of the flow structure: whether abnormal P&L stems from client behaviour, market conditions, or internal systems.
Typical Use Cases
Imagine a period of increased volatility or low liquidity. A specific symbol suddenly produces unusually high profits for a subset of clients — a classic signal that latency or mispricing could be exploited. With symbol-level monitoring, the dealing desk can flag or block the instrument, adjust liquidity routing, or tighten controls on exposure before the behaviour becomes systemic.
How to Act on Alerts
Once the system signals an anomaly, risk managers should: verify quote-feed integrity, review recent fills for latency issues, examine which accounts or clusters contributed to the abnormal P&L, and — if needed — adjust hedging strategies or apply stricter controls on that symbol. Documenting these events helps refine internal policies and prevent recurrence.
Conclusion
Symbol-level unusual P&L monitoring provides a fine-grained, early-warning mechanism that helps brokers stay ahead of hidden risks. When combined with clustering, execution controls and real-time dashboards, it becomes a cornerstone of robust risk infrastructure — protecting profitability and ensuring transparency in fast and calm markets alike.
See It in Action
To explore how symbol-level anomalies appear in practice and how Brokerpilot visualises them, you can request a live demonstration. During the demo, you will see real-time dashboards, alert triggers, and symbol-by-symbol P&L tracking — giving you a full picture of how the system safeguards against silent losses.
Request a demo to evaluate symbol-level monitoring on your book and improve visibility into risk-driving instruments.