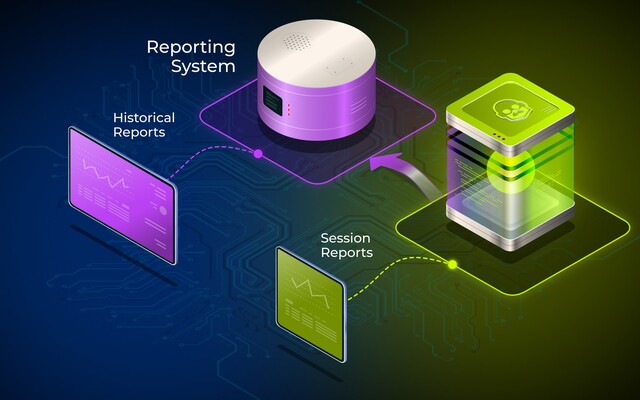
Real-time monitoring answers one question: what is happening right now. The reporting system answers another: what happened, when did it start, and what pattern does it follow.
Both matter. A broker who can see the current state of dealing in two or three clicks but cannot examine what led to a position, a loss or a client behaviour pattern is working with half the picture. The reporting system is the other half.

What the reporting system contains
The collection includes more than forty reports and dashboards covering P&L by day, week and month, broken down by account, account group and instrument group. A flexible filter system allows almost any slice of historical data — by period, instrument, client segment, group structure or custom parameter. Reports can be exported in standard formats for further analysis in external tools.
If a specific report is not in the collection, it can be built on request. The underlying data is already there — the format is the only variable.
Why history and real time belong together
The real-time snapshot in Brokerpilot shows the current state of dealing. Historical reporting shows how that state developed over time — which instruments tend to create exposure clusters, which client groups generate the most P&L pressure during specific sessions, where the gaps between expected and actual results consistently appear.
That context is what allows brokers to calibrate rules rather than just react to events. A trigger threshold set without historical data is a guess. Set against months of dealing history, it becomes a decision. For a closer look at how reporting and automation work together: automated risk management and the decision layer.
The Reporting System is part of Brokerpilot's reporting and analytics product.
Request a demo → to explore the full reporting collection on your dealing data.