Broker Risk Monitoring Dashboards
Visual dashboards showing broker exposure, trading activity and operational performance in real time. Brokerpilot dashboards help teams monitor key risk indicators and understand what is happening across the trading environment.
Real-Time Broker Monitoring
Dashboards provide a visual overview of broker operations and risk indicators. Instead of reviewing multiple reports, teams can monitor key metrics from one interface. Brokerpilot dashboards display exposure levels, trading volumes, account activity and operational indicators in real time.
- Broker exposure indicators
- Trading volume metrics
- Account activity metrics
- Operational risk indicators
Understand Broker Performance
Broker performance depends on trading activity, exposure and client behaviour. Visual dashboards allow teams to quickly understand how these factors influence the trading book. Brokerpilot dashboards present operational data in a format that is easy to review during active trading sessions.
- PnL Details
- Session Realized
- Equities by Groups
- Top Accounts Volumes
Monitor Account Activity
Account activity is an important signal of broker performance and operational conditions. Brokerpilot dashboards allow teams to monitor deposits, withdrawals and trading behaviour alongside other operational metrics.
- Deposits and withdrawals monitoring
- Account activity indicators
- Client trading behaviour metrics
- Account performance signals
Dashboard Interface
Brokerpilot dashboards provide a structured interface where key broker metrics are displayed in real time. The interface allows teams to quickly identify changes in trading activity or broker exposure.
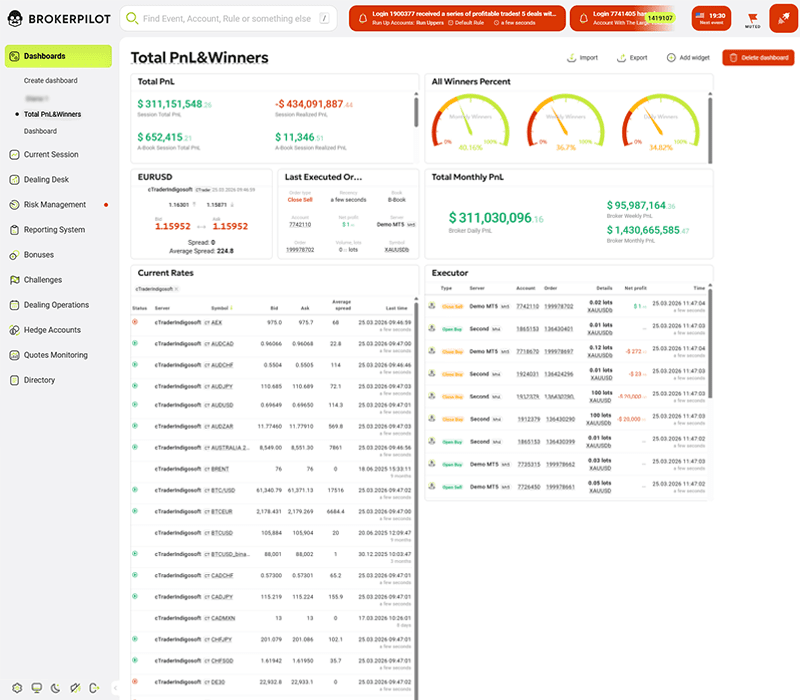
PnL & Execution Dashboard 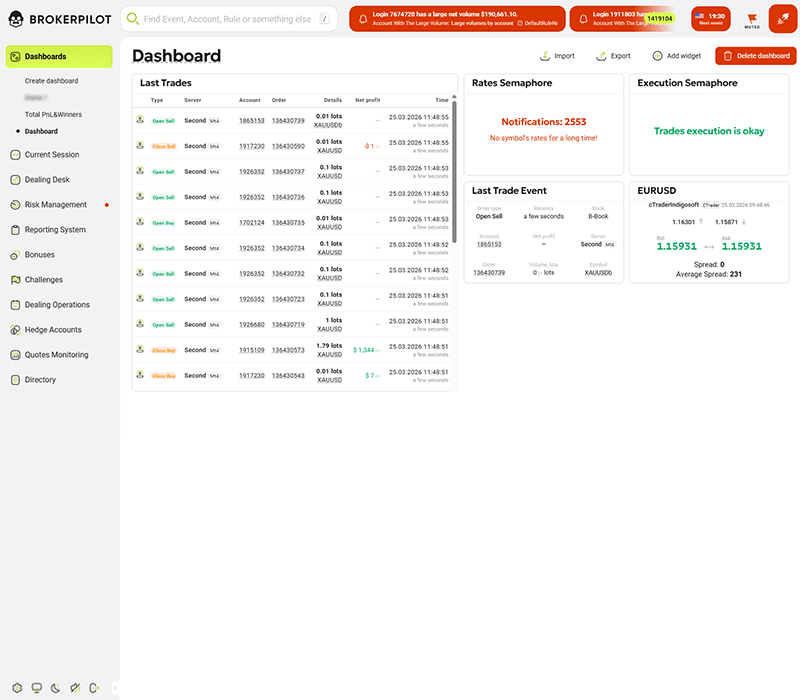
Dealing Control Dashboard 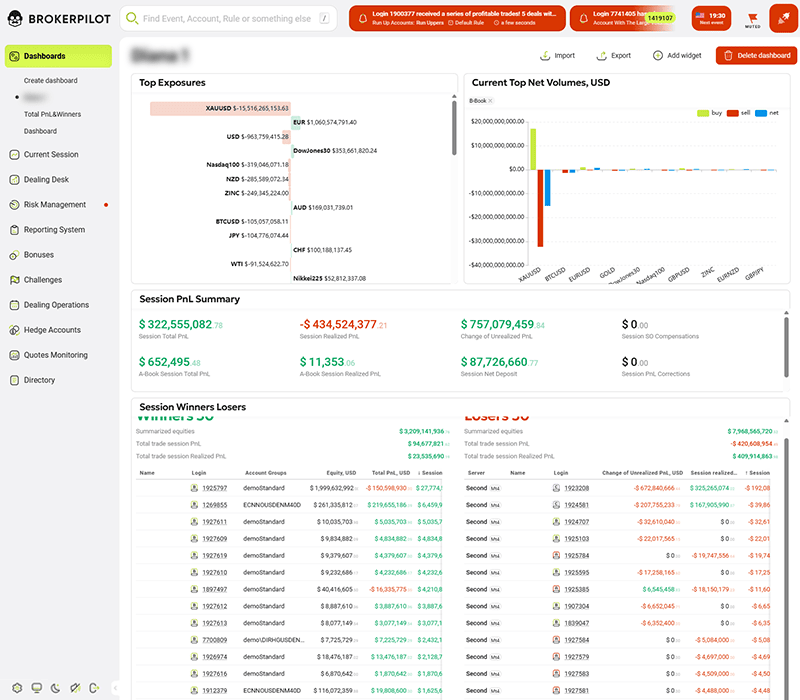
Session Risk Dashboard
Modules Connected to Dashboards
- Risk Management
- Reporting System
- Dealing Desk
Supported Trading Platforms
Brokerpilot dashboards display operational data collected from broker trading platforms.